Standard Deviation in Math is a measure of the spread regarding a set of data.
Specifically, what standard deviation tells us is how far away the values of a data set are from the average/mean value.
The smaller the Standard Deviation value, then the less spread out from the average a set/group of data is.
Standard Deviation is a measure that can often be useful. As sometimes an average value can be a good fit for a set/group of data values, but there are also situations when an average value may not be a good fit.
We can observe this below in 2 examples of working out the average/mean of a set of numbers.
Calculating the Mean/Average Examples
(1.1)
List of 7 numbers:
5 , 7 , 3 , 5 , 6 , 4 , 5
Mean/average = \bf{\frac{5 \space + \space 7 \space + \space 3 \space + \space 5 \space + \space 6 \space + \space 4 \space + \space 5}{7}} = \bf{\frac{35}{7}} = 5
The average for the list of numbers is 5, and it turns out that all values in the list are close to this value.
(1.2)
List of 7 numbers:
3 , 10 , 12 , 5 , 18 , 6 , 2
Mean/average = \bf{\frac{3 \space + \space 10 \space + \space 12 \space + \space 5 \space + \space 18 \space + \space 6 \space + \space 2}{7}} = \bf{\frac{56}{7}} = 8
The average of the list of numbers here is 8, however there are some values that are quite a distance away from that value, especially 18.
Calculating Standard Deviation
The Standard Deviation of a set of data values, is a vale that helps to give a measure of how spread out the values in that set are from the mean/average. This is what standard deviation tells us.
The Standard Deviation of a set of data values, is in fact the square root of the variance of the data values.
So in order to establish the standard deviation of a data set, we first need to know the variance number.
Variance is given by the formula:
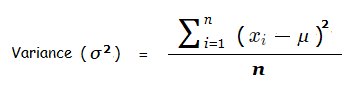
σ is known as the delta symbol, and it is the common symbol used as notation for Standard Deviation.
n is the amount of values, and \mu is the average/mean.
Calculating Standard Deviation Example
(2.1)
If we look at the same list of 7 numbers from example (1.1).
5 , 7 , 3 , 5 , 6 , 4 , 5 = \lbrace \space x_1 \space , \space x_2 \space , \space x_3 \space , \space x_4 \space , \space x_5 \space , \space x_6 \space , \space x_7 \space \rbrace
n = 7 , μ = 5
\sum_{i=1}^7 \space(x_i \space – \space \mu)^2
= ( x_1 − 5 )2 + ( x_2 − 5 )2 + ( x_3 − 5 )2 + ( x_4 − 5 )2 + ( x_5 − 5 )2 + ( x_6 − 5 )2 + ( x_7 − 5 )2
= ( 5 − 5 )2 + ( 7 − 5 )2 + ( 3 − 5 )2 + ( 5 − 5 )2 + ( 6 − 5 )2 + ( 4 − 5 )2 + ( 5 − 5 )2
= 0 + 4 + 4 + 0 + 1 + 1 + 0 = 10
σ = \bf{\sqrt{\frac{10}{7}}} = 1.195
What Standard Deviation tells us,
Using the Standard Deviation Value
Now considering the Standard Deviation is an indicator of how far away a set of values are from the mean/average.
Let’s see how we can make use of it with the list of 7 numbers.
For 5 , 7 , 3 , 5 , 6 , 4 , 5, the mean is 5.
While the Standard Deviation is 1.195.
We can establish how far way 1 Standard Deviation is from the mean/average in both a positive direction and a negative direction also.
5 − 1.195 = 3.805 , 5 + 1.195 = 6.195
What this means is that we should expect to see the majority of the values in the list of 7 to be between 3.805 and 6.195.
From looking at the list, this does turn out to be the case.
With only 3 and 7 being out side of this range.
Alternative Formula for Standard Deviation
The variance does have a slightly simpler and quicker formula that can be used. This leads us to an alternative formula for Standard Deviation that can also be used, which is:
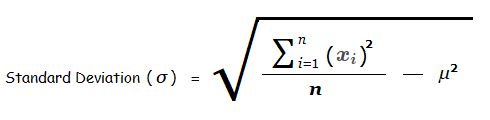
Again μ is the mean/average, and n represents the number of values.
So the calculations required for example (2.1) from above using this formula are:
σ = \bf{\sqrt{{\frac{5^2 \space + \space 7^2 \space + \space 3^2 \space + \space 5^2 \space + \space 6^2 \space + \space 4^2 \space + \space 5^2}{7}} \space – \space 5^2}} = \bf{\sqrt{\frac{185}{7} \space – \space 25}} = 1.195
- Home ›
- Probability/Stats › Standard Deviation