The exponential function along with the logarithmic function, and their relationship with each other were shown on the exponential function and logarithms introduction page.
When we are dealing with real numbers.
Exponential function. f(x) = a^x, a > 0
Logarithmic Function. f(x) \space {\small{=}} \space{\tt{log}}_a (x) , a > 0 \space \space , \space \space a \space {\cancel{=}} \space 1 \space \space , \space \space x > 0.
The functions are the inverse of the other.
a^{{\tt{log}}_a (x)} \space {\small{=}} \space x => {\tt{log}}_a (a^x) \space {\small{=}} \space x
This page will focus on some exponential function graph examples. Studying the standard form of the graphs, and how they can differ on the cartesian axis.
Exponential Function Graph
Examples
When we have, f(x) = a^x, a > 0.
The overall shape of the graph is influenced by the value of a.
a > 1
We can look at a case of a > 1.f(x) \space {\small{=}} \space 2^x
Now to obtain some points on the graph.
f({\text{-}}2) \space {\small{=}} \space 2^{{\text{-}}2} \space {\small{=}} \space \frac{1}{2^2} \space {\small{=}} \space \frac{1}{4}
f({\text{-}}1) \space {\small{=}} \space 2^{{\text{-}}1} \space {\small{=}} \space \frac{1}{2^1} \space {\small{=}} \space \frac{1}{2}
f(0) \space {\small{=}} \space 2^{0} \space {\small{=}} \space 1
f(1) \space {\small{=}} \space 2^{1} \space {\small{=}} \space 2
f(2) \space {\small{=}} \space 2^{2} \space {\small{=}} \space 4
We have found the points ({\text{-}}2,\frac{1}{4}) , ({\text{-}}1,\frac{1}{2}) , (0,1) , (1,2) , (2,4).
This information can now help in drawing the graph for f(x) \space {\small{=}} \space 2^x.
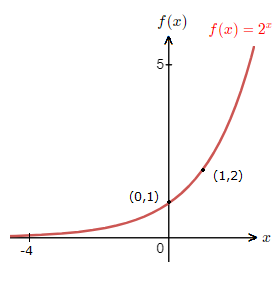
This exponential function graph above is the standard shape for a function of the form f(x) \space {\small{=}} \space a^x, where a > 1.
The following can be observed.
– As x gets larger, the graph tends to positive infinity.
– As x decreases and gets smaller, the graph trends towards 0.
– The graph is increasing and crosses the y-axis.
– The graph will pass through (0,1), and for f(x) \space {\small{=}} \space a^x, will pass through (1,a).
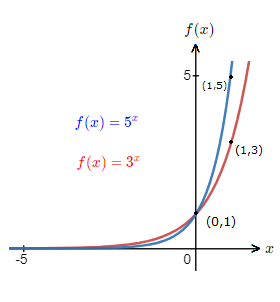
Below is another graph with 2 other exponential function graphs for a > 1.
Where we can see how the graph shape is affected by a differing value of a.
a < 0 < 1
The other case for exponential function graphs is, 0 \lt a \lt 1.We can look at f(x) \space {\small{=}} \space (\frac{1}{2})^x.
Again establishing some points on the graph.
f({\text{-}}2) \space {\small{=}} \space (\frac{1}{2})^{{\text{-}}2} \space {\small{=}} \space \frac{2^2}{1} \space {\small{=}} \space 4
f({\text{-}}1) \space {\small{=}} \space (\frac{1}{2})^{{\text{-}}1} \space {\small{=}} \space \frac{2^1}{1} \space {\small{=}} \space 2
f(0) \space {\small{=}} \space (\frac{1}{2})^0 \space {\small{=}} \space 1
f(1) \space {\small{=}} \space (\frac{1}{2})^{1} \space {\small{=}} \space \frac{1}{2}
f(2) \space {\small{=}} \space (\frac{1}{2})^{2} \space {\small{=}} \space \frac{1}{4}
We have the points ({\text{-}}2,4) , ({\text{-}}1,2) , (0,1) , (1,\frac{1}{2}) , (2,\frac{1}{4}).
With these numbers we can now make a drawing of the graph for f(x) \space {\small{=}} \space (\frac{1}{2})^x.
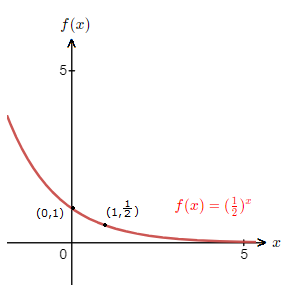
This exponential function graph above is the standard shape for a function of the form f(x) \space {\small{=}} \space a^x, where 0 \lt a \lt 1.
The following can be observed.
– As x gets larger, the graph trends towards 0.
– As x decreases and gets smaller, the graph tends to positive infinity.
– The graph is decreasing and crosses the y-axis.
– The graph will pass through (0,1), and for f(x) \space {\small{=}} \space a^x, will pass through (1,a).
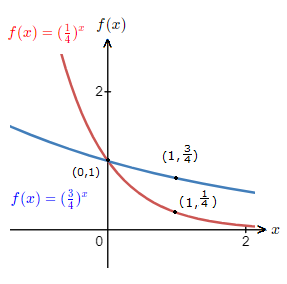
The diagram below is a graph with 2 other exponential function graphs for 0 \lt a \lt 1.
We can observe how the graph shape is affected by a differing value of a.
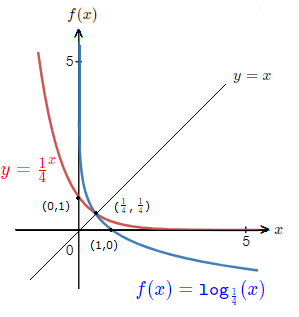
Relationship with the Logarithmic Function Graph
An exponential function is the inverse of its corresponding logarithmic function.
As such, the graph of the functions are reflected in the line y = x.
The coordinates on the graphs are swapped around.